
SigmaGraph Portable
2.6.10Manage and perform statistical operations on your databases or create graphs to help you interpret the data better with this application
Irrespective of whether you are working in the field of social sciences or in the economic sector, sooner or later you are bound to analyze and interpret databases using advanced mathematics and statistical equations.
SigmaGraph Portable is a lightweight application that enables you to manage small to large databases seamlessly and interpret them using graphic tools.
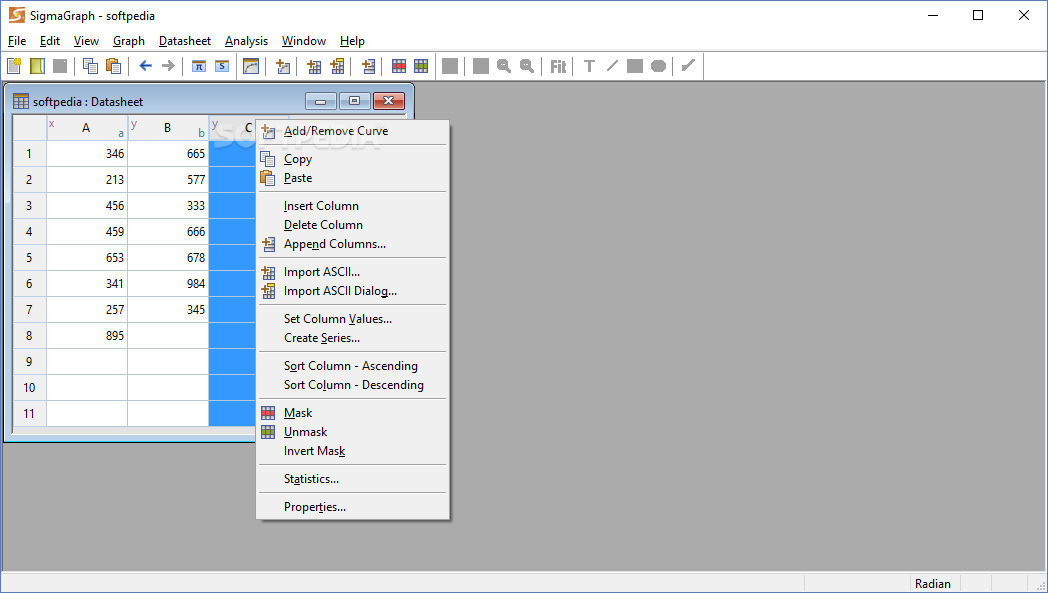
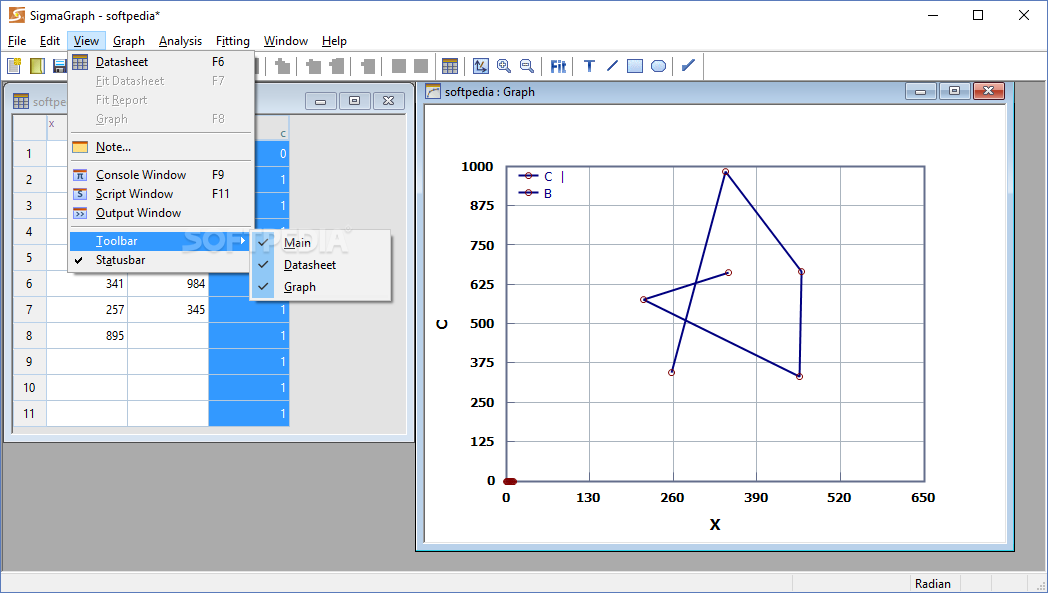
Not only is the interface clear and modern, but it is intuitive enough so you can navigate through it seamlessly even as a first-time user. The UI is composed of a main window that serves as a background for the various panels you can open when analyzing the database.
It is worth mentioning that you can open as many datasheets and graphs as you wish, a feature that can be useful when you are examining multiple variables for a questionnaire for instance. Moreover, you can specify a few details – number of rows, delimitation, etc. – before opening the database.
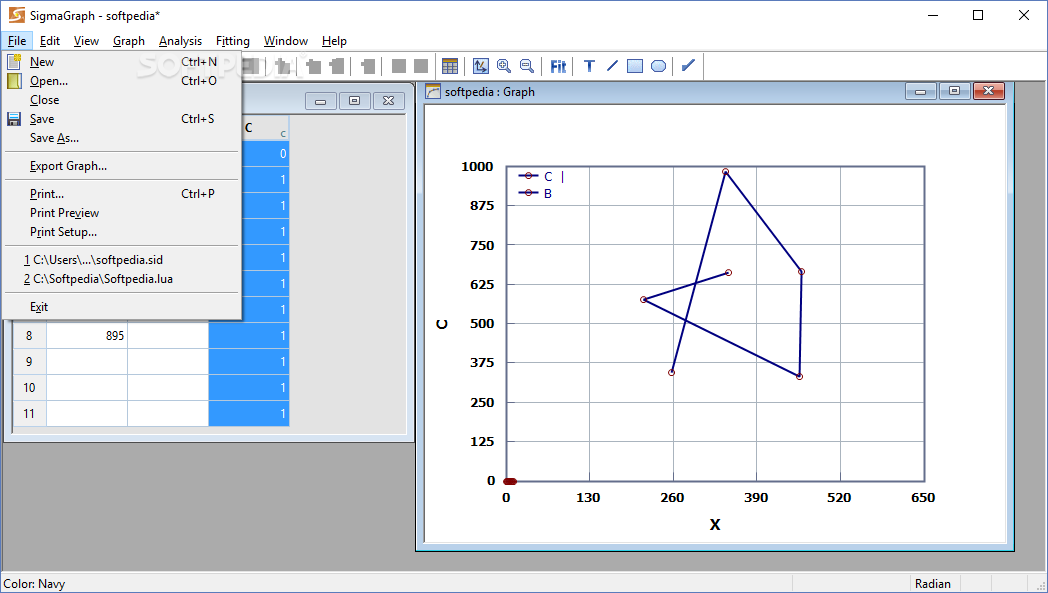
On a side note, you should know that the application works with limited data files, namely SID, TXT, CSV, LUA and DAT files. Then again, opening and previewing the files is a simple matter of drag and drop.
The app incorporates various tools – integrate, differentiate, average, autocorrelation and FFT – that you can use to analyze the numeric data in your datasheets. On the other hand, you cannot perform advanced mathematical or statistical calculations via the program.
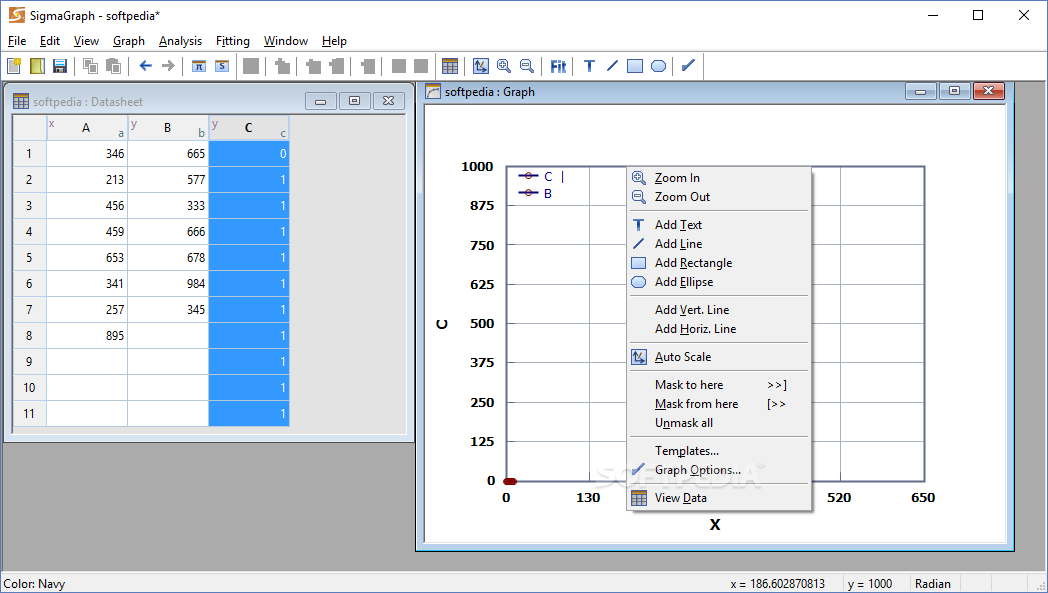
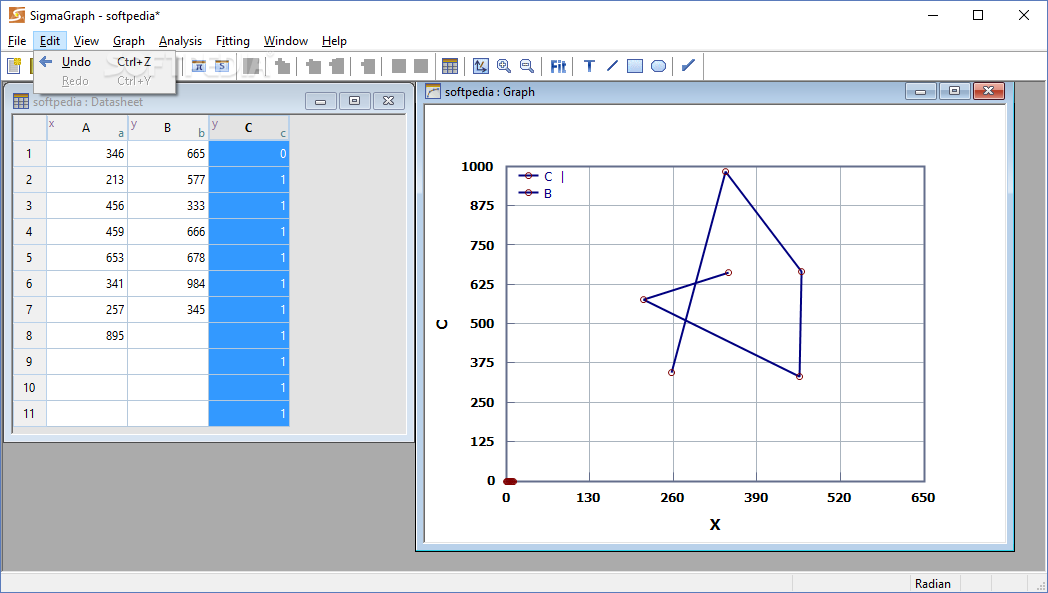
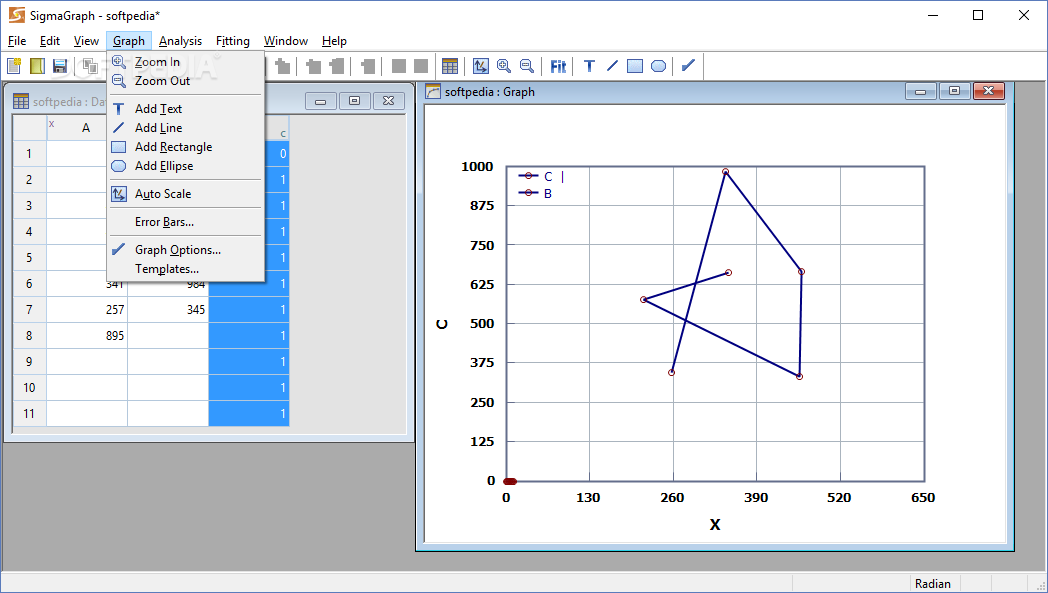
In case you are having a hard time identifying patterns or exceptions in your database, then you can employ the help of the graph function, a feature that can aid you discover errors that you did not notice before.
You should know that the graphs are editable in the sense that you can add text, lines, rectangle, ellipses and mask or unmask sections, according to the needs and specifications of the variables you are following.
Coming with a clean interface and incorporating a plethora of features to generate graphs, SigmaGraph Portable can be the utility you need to interpret data for your studies easier.
SigmaGraph Portable is a lightweight application that enables you to manage small to large databases seamlessly and interpret them using graphic tools.
Clean, modern and well-organized interface
Not only is the interface clear and modern, but it is intuitive enough so you can navigate through it seamlessly even as a first-time user. The UI is composed of a main window that serves as a background for the various panels you can open when analyzing the database.
It is worth mentioning that you can open as many datasheets and graphs as you wish, a feature that can be useful when you are examining multiple variables for a questionnaire for instance. Moreover, you can specify a few details – number of rows, delimitation, etc. – before opening the database.
On a side note, you should know that the application works with limited data files, namely SID, TXT, CSV, LUA and DAT files. Then again, opening and previewing the files is a simple matter of drag and drop.
Enables you to analyze data and generate graphs easily
The app incorporates various tools – integrate, differentiate, average, autocorrelation and FFT – that you can use to analyze the numeric data in your datasheets. On the other hand, you cannot perform advanced mathematical or statistical calculations via the program.
In case you are having a hard time identifying patterns or exceptions in your database, then you can employ the help of the graph function, a feature that can aid you discover errors that you did not notice before.
You should know that the graphs are editable in the sense that you can add text, lines, rectangle, ellipses and mask or unmask sections, according to the needs and specifications of the variables you are following.
An overall good tool for data interpretation
Coming with a clean interface and incorporating a plethora of features to generate graphs, SigmaGraph Portable can be the utility you need to interpret data for your studies easier.
6.8 MB
Info
Update Date
Nov 08 2020
Version
2.6.10
License
Freeware
Created By
Sidi Hamady
Related software CAD


