
PlotLab VC++
8.0.0.0A package of MFC-compatible Visual C++ components for data visualization that enables the creation of complex and sophisticated charts and interactive graphs
PlotLab VC++ is an extensive suite meant to increase the performance of your systems. Among others, these utilities provide the necessaries for data plotting in logarithmic or linear modes.
The more extensive PlotLab suite contains multi-purpose editions such as PlotLab VC++ (a set of native Visual C++ classes), the VCL - Firemonkey version, and the .NET supporting one. All components are dedicated to Windows OS exclusively and are compatible with both 32-bit and 64-bit systems.
The PlotLab VC++ library is a resourceful instrument that can bring value to your projects, as it facilitates many processes and eases recurrent tasks. For example, some of the applications you could find for PlotLab VC++ are real-time data acquisition, (digital) signal analysis, video content analysis, data visualization and analysis, and more.
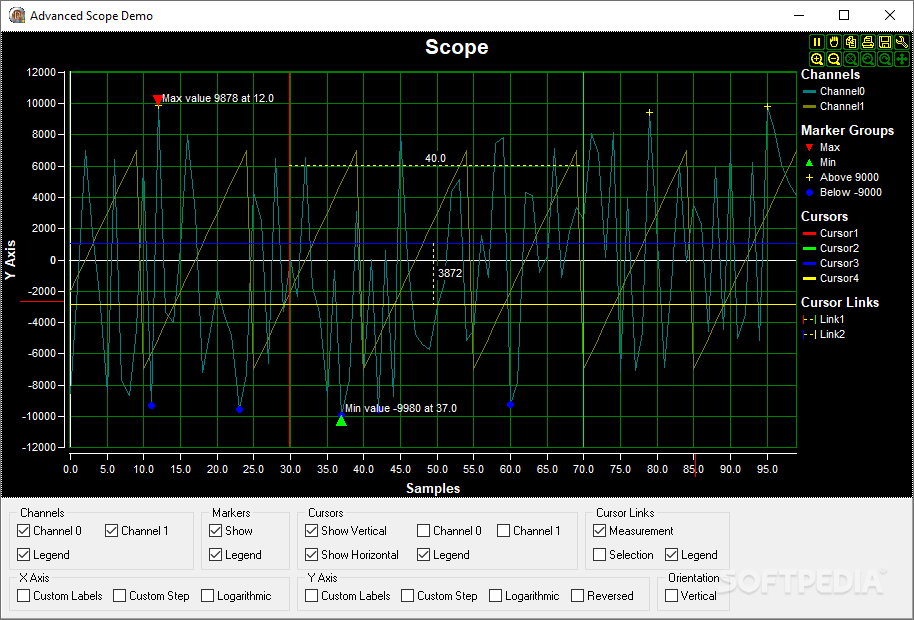
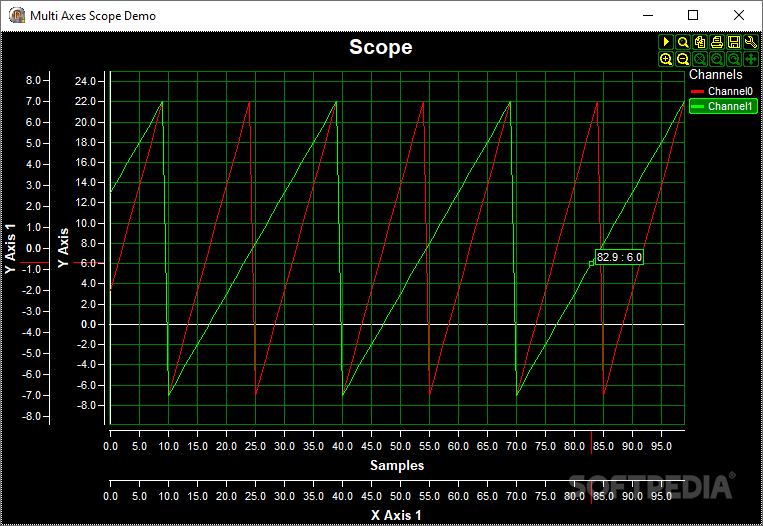
Among the multiple parts that this library has, there are three main directions — the Chart-like Plot component, the Single-Waterfall component, and the Multi-Waterfall one. The Scope control (the equivalent of the Chart-like Plot elements) allows for fast multi-channel arrangement of large sets of data in logarithmic or linear patterns.
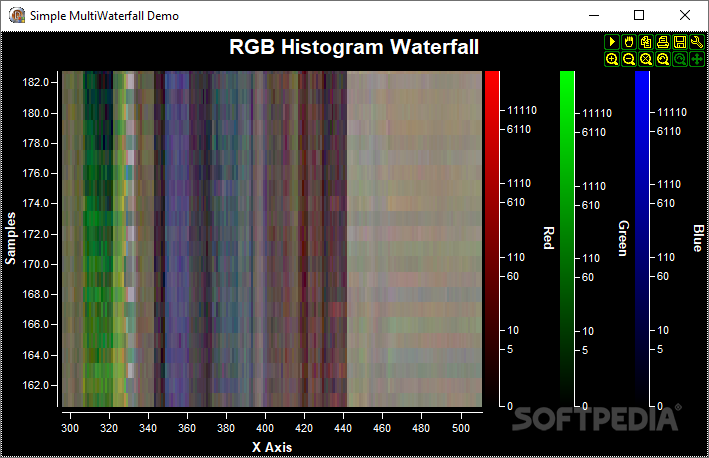
The Single- and Multi-Waterfall components can generate individual, respectively, multiple channels for data representations. These allow displaying Real(double) data, adding layers to any drawing component for rendering video layers, or showing simultaneous representations of important, individual channel markers, selections, or measurements. The latter is crucial for highlighting important points on all custom-label channels.
All things considered, if you are in need of a library that can help speed up the addition of graphs, charts, plots, or waterfalls to your Visual C++ project, then PlotLab VC++ is totally worth a shot.
The more extensive PlotLab suite contains multi-purpose editions such as PlotLab VC++ (a set of native Visual C++ classes), the VCL - Firemonkey version, and the .NET supporting one. All components are dedicated to Windows OS exclusively and are compatible with both 32-bit and 64-bit systems.
The PlotLab VC++ library is a resourceful instrument that can bring value to your projects, as it facilitates many processes and eases recurrent tasks. For example, some of the applications you could find for PlotLab VC++ are real-time data acquisition, (digital) signal analysis, video content analysis, data visualization and analysis, and more.
Among the multiple parts that this library has, there are three main directions — the Chart-like Plot component, the Single-Waterfall component, and the Multi-Waterfall one. The Scope control (the equivalent of the Chart-like Plot elements) allows for fast multi-channel arrangement of large sets of data in logarithmic or linear patterns.
The Single- and Multi-Waterfall components can generate individual, respectively, multiple channels for data representations. These allow displaying Real(double) data, adding layers to any drawing component for rendering video layers, or showing simultaneous representations of important, individual channel markers, selections, or measurements. The latter is crucial for highlighting important points on all custom-label channels.
All things considered, if you are in need of a library that can help speed up the addition of graphs, charts, plots, or waterfalls to your Visual C++ project, then PlotLab VC++ is totally worth a shot.
172 MB
Info
Update Date
Nov 27 2020
Version
8.0.0.0
License
Shareware
Created By
Mitov Software
Related software Development


