
ggplot2
3.3.5Create beautiful and explicit layered graphics in R for both simple and complex datasets using this utility based on The Grammar of Graphics
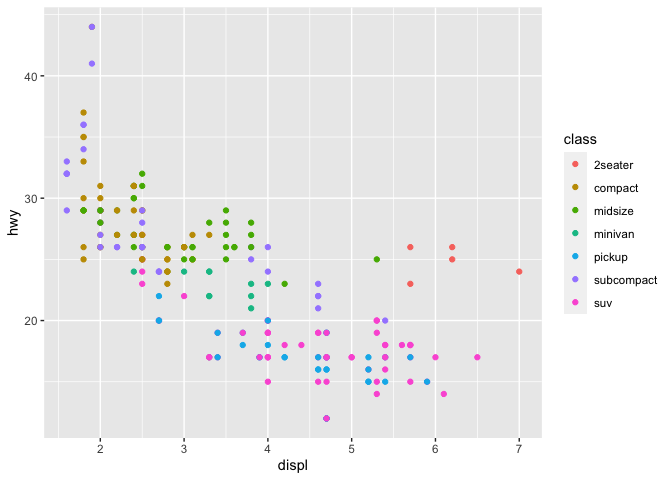
The Grammar of Graphics, now available in its second edition, is a framework book that enables users to learn effective strategies for data visualization. The main idea here is to describe and construct graphics on more than two data dimensions in a structured manner that accounts for date, aesthetics, scale, geometry, statistics, facets and coordinate systems.
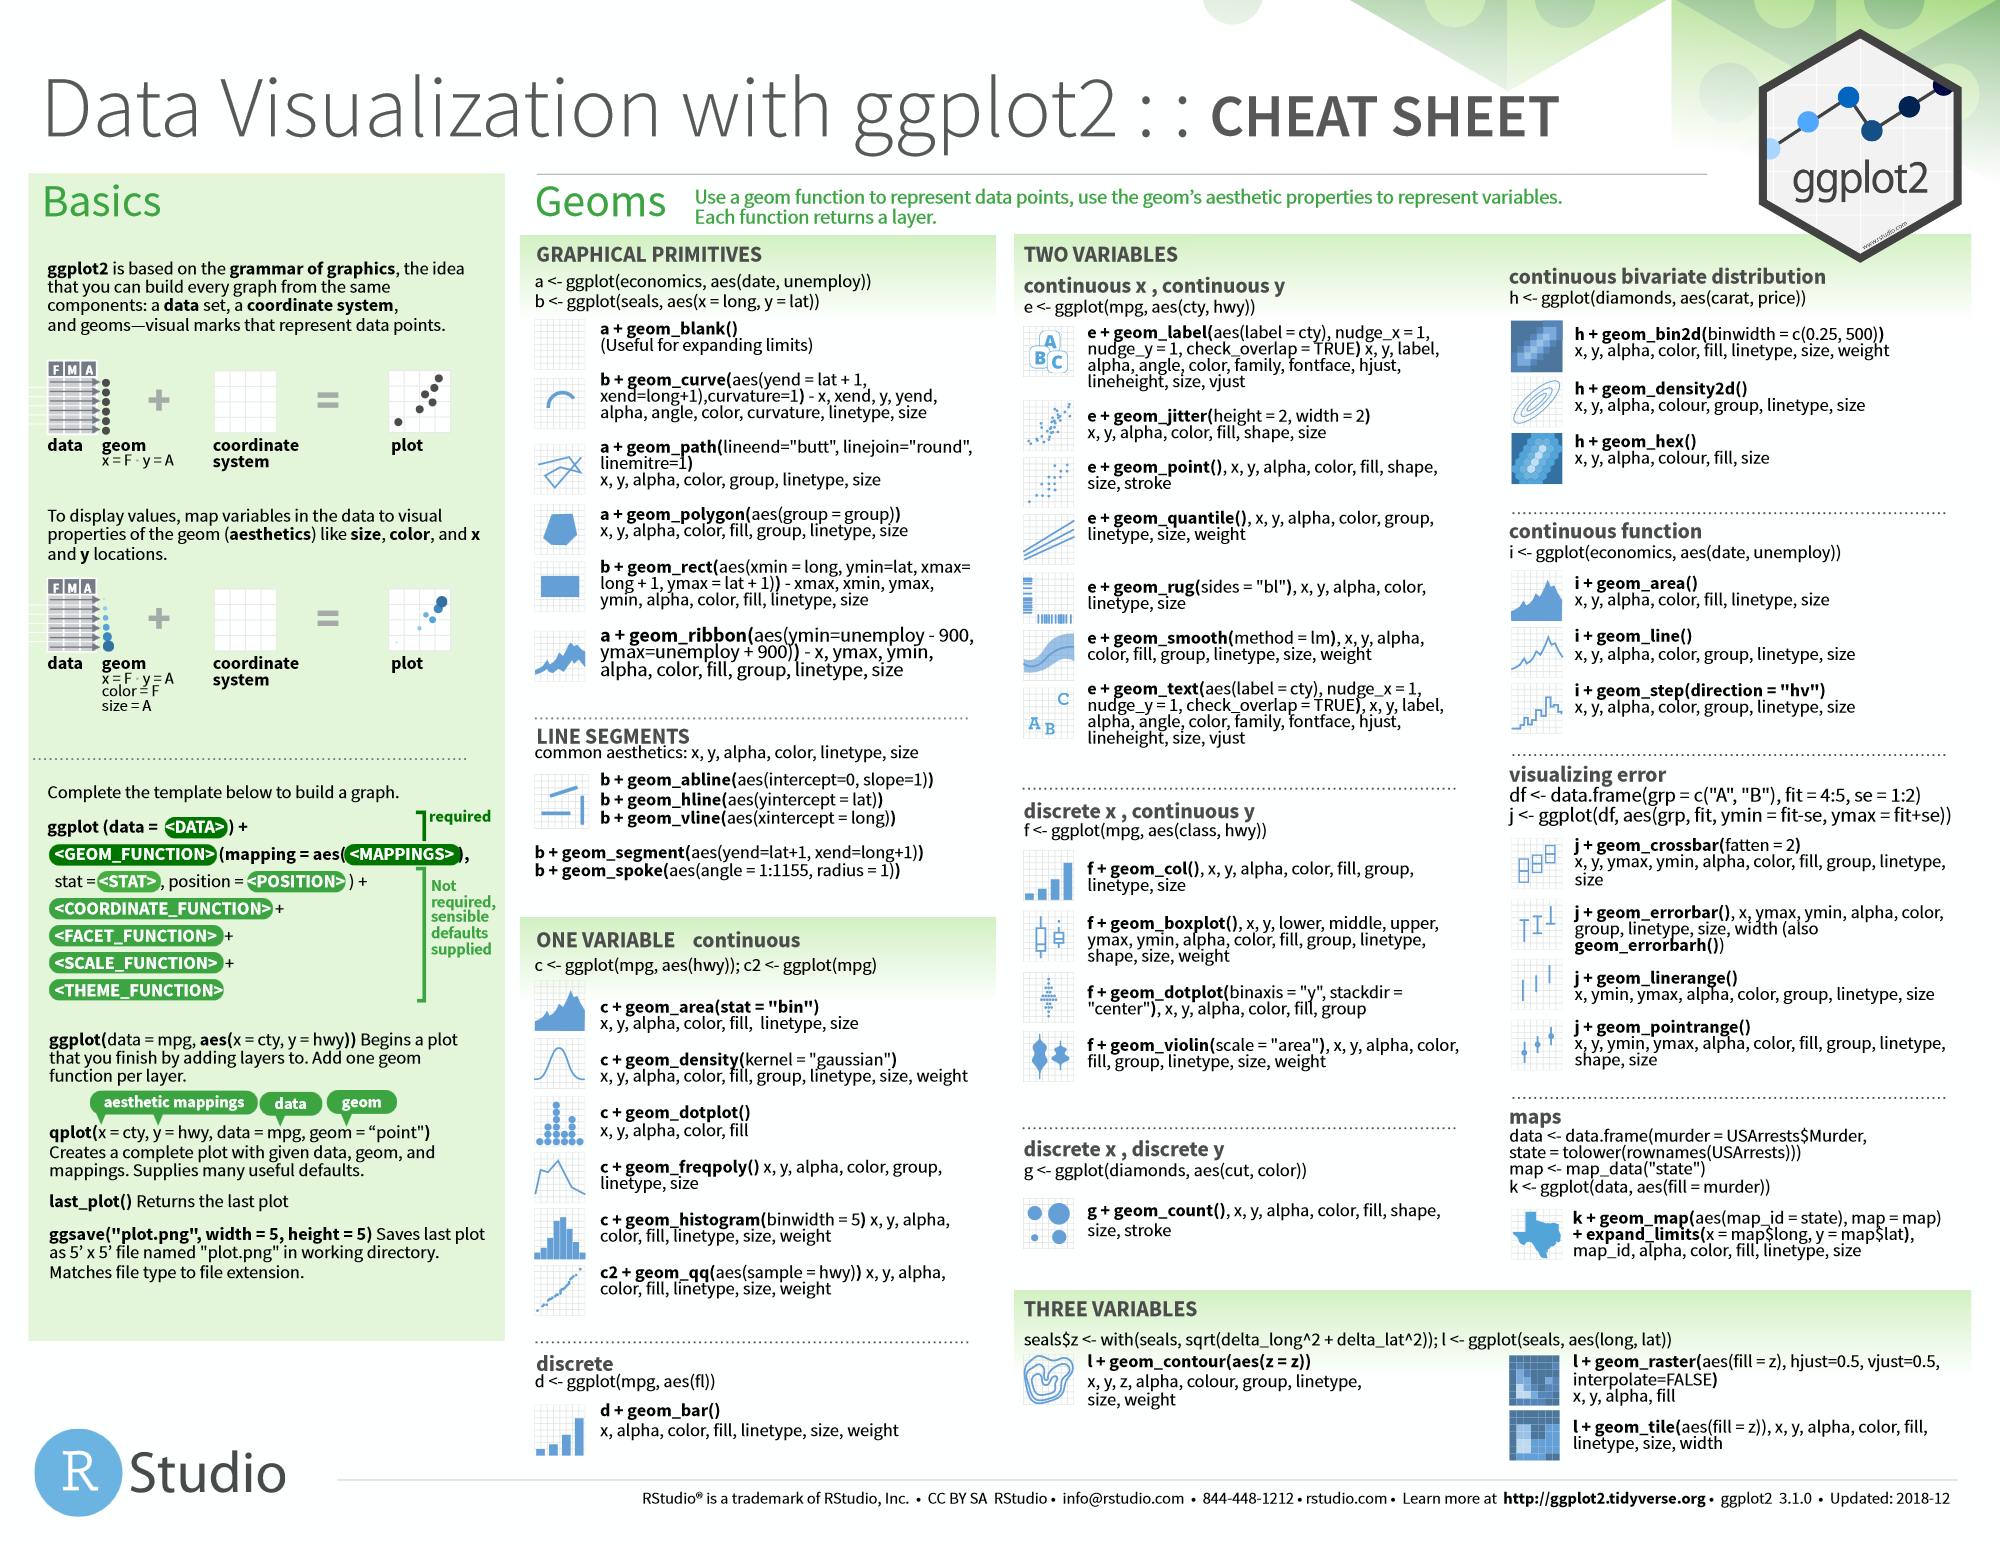
ggplot2 is an open-source utility that wants to implement the principles of The Grammar of Graphics in R. Therefore, users provide the graphical primitives, the data and indicate how the map variables to aesthetics so that the app can take care of the details. Simply put, the app can help create graphics easy to understand when supplied with a dataset, aesthetic mapping, layers, scales, faceting specifications and coordinate systems.
The tool may come in handy for professionals who typically work with a lot of data they need to plot, as the app can create both simple and complex data visualization. The advantage here is that instead of having to work with multiple systems, the app enables professionals to rely on a single system to create layered plots that can be explored with ease. In addition, the app enables users to add or remove complexity to the graphics easier.
3.3 MB
Info
Update Date
Jun 24 2021
Version
3.3.5
License
MIT License
Created By
tidyverse
Related software Development


